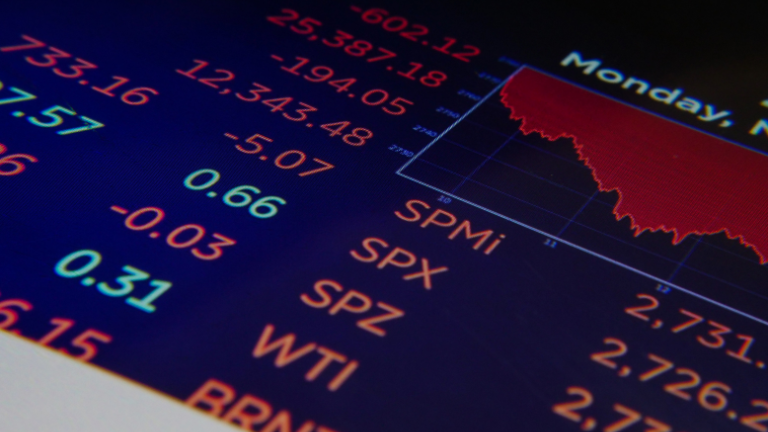
Stock market indices are benchmarks that measure the performance of a specific group of stocks within a particular market. These indices provide a snapshot of market sentiment and economic health, helping investors and traders gauge the overall direction of the market.
Stock indices play a significant role in forex trading because they serve as leading indicators of global risk sentiment. When stock markets perform well, it often signals a “risk-on” environment, encouraging investments in higher-yielding currencies like the AUD, NZD, or CAD. Conversely, during stock market declines, traders tend to shift to “safe-haven” assets, such as the USD, JPY, or CHF, driving movements in the forex market.
By understanding the relationship between stock indices and forex, traders can gain insights into global economic trends, identify shifts in investor sentiment, and anticipate currency price movements.
This guide aims to empower traders with the knowledge and tools needed to use stock market indices as a valuable component of their forex trading strategy. By the end of this guide, you will understand how to analyze stock indices, interpret their movements, and incorporate this information into your forex trading decisions.
Understanding the Stock-Forex Relationship
Risk Sentiment and Its Impact on Forex Markets
Stock indices are a powerful gauge of global risk sentiment, which is a crucial driver in forex markets. Risk sentiment refers to how investors perceive the financial environment—whether they are willing to take risks (risk-on) or seek safety (risk-off).
- Risk-On Sentiment:
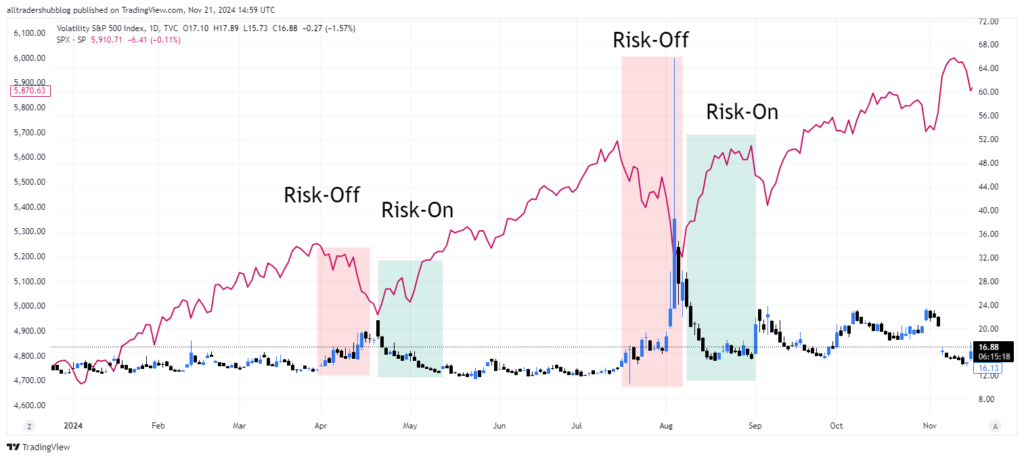
When stock indices rise, it often signals investor confidence in economic growth. This “risk-on” environment typically leads to an increase in demand for higher-yielding, risk-sensitive currencies such as the Australian Dollar (AUD), New Zealand Dollar (NZD), or Canadian Dollar (CAD). - Risk-Off Sentiment:
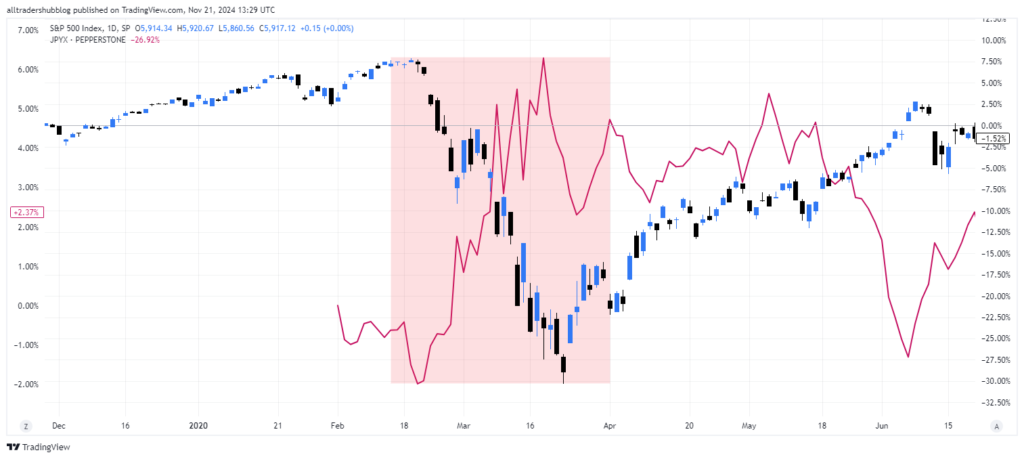
Conversely, falling stock indices signal fear or uncertainty in the markets, prompting a “flight to safety.” This increases demand for safe-haven currencies like the U.S. Dollar (USD), Japanese Yen (JPY), and Swiss Franc (CHF).
For example, during the COVID-19 pandemic’s initial phase in 2020, global stock indices plummeted, and safe-haven currencies like the USD and JPY appreciated significantly.
Correlations Between Specific Stock Market Indices and Currencies
Certain stock indices have a direct influence on specific currency pairs due to regional economic ties or capital flow patterns. Understanding these relationships can provide valuable clues for forex trading:
- S&P 500 (USA) and USD:
A strong S&P 500 often correlates with a weaker USD in a risk-on environment, as investors seek higher returns in riskier assets abroad. However, in times of extreme risk-off sentiment, the USD strengthens due to its status as a global reserve currency. - Nikkei 225 (Japan) and JPY:
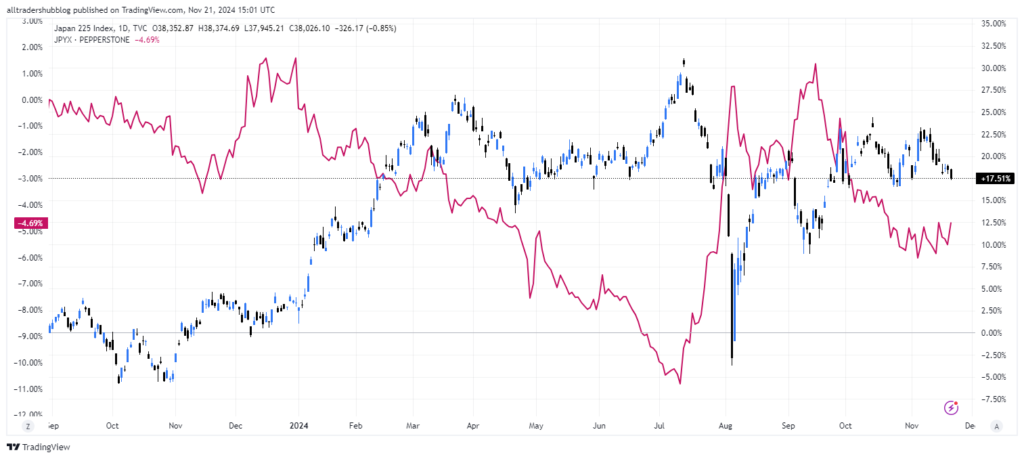
The Nikkei 225 often has an inverse relationship with the JPY. A rising Nikkei usually weakens the JPY as capital flows out of Japan, whereas a falling Nikkei strengthens the JPY due to repatriation of funds during risk-off scenarios. - DAX 40 (Germany) and EUR:
The DAX 40 impacts the Euro (EUR) due to Germany’s role as the Eurozone’s largest economy. Strong performance in the DAX often signals economic optimism in the region, bolstering the EUR.
Stock Market Indices as Economic Proxies
Stock indices do more than reflect market sentiment—they also serve as proxies for the underlying economic health of their regions.
- Economic Growth Indicators:
Stock indices typically rise during periods of robust economic performance, suggesting stronger domestic currency trends. For example, a rally in the S&P 500 might indicate confidence in the U.S. economy, which could lead to USD strength unless offset by risk-on flows. - Market Expectations:
Indices also react to future expectations of growth, corporate earnings, or central bank policy. A sharp rally or decline often signals changes in these expectations, which forex traders can leverage to predict currency movements.
Key Stock Market Indicators to Monitor
To effectively use stock market indices as leading indicators for forex trading, traders must understand which indices and metrics to focus on. Each index offers unique insights depending on its geographical and economic context. Monitoring these key indicators can help you gauge global risk sentiment and predict potential currency movements.
Major Global Stock Market Indices to Focus On
- U.S. Indices:
- S&P 500: A broad representation of the U.S. economy, this index reflects the performance of 500 large-cap companies. Its movements can signal shifts in global risk sentiment and USD trends.
- NASDAQ: Tech-heavy and more volatile, the NASDAQ can indicate investor appetite for growth-oriented, riskier assets.
- Dow Jones Industrial Average (DJIA): Often viewed as a stability benchmark, the DJIA offers insights into blue-chip stock performance and overall economic confidence.
- European Indices:
- DAX 40 (Germany): A key barometer for the Eurozone’s largest economy, the DAX’s performance can signal economic strength or weakness in the Euro area, impacting EUR.
- FTSE 100 (UK): Influenced by global commodities and multinational corporations, this index provides insights into GBP movements.
- CAC 40 (France): A significant index for the Eurozone, tracking the performance of France’s top companies.
- Asian Indices:
- Nikkei 225 (Japan): Highly correlated with JPY movements, this index reflects investor sentiment in Asia and is sensitive to global risk appetite.
- Hang Seng (Hong Kong): A proxy for Chinese economic conditions and risk sentiment in Asia, influencing currencies like AUD, NZD, and CNY.
- Shanghai Composite (China): Directly tied to the Chinese economy, offering insights into trade-sensitive currencies such as AUD and NZD.
Data Points to Watch
Certain data points within stock indices can serve as early warning signs or confirmations of market trends. Pay attention to the following:
- Opening Gaps and Pre-Market Futures:
- Opening Gaps: Large gaps in index prices at market open often signal significant changes in sentiment due to overnight news or economic events.
- Pre-Market Futures: Futures contracts on major indices provide an early indication of the market’s direction before official trading hours.
- Weekly and Monthly Performance Trends:
- Sustained upward or downward trends over a week or month reflect shifts in investor sentiment, which can translate to forex market momentum.
- Reaction to Earnings Reports:
- Quarterly earnings of major companies often impact stock indices, providing insight into economic health. For example, strong earnings in tech-heavy NASDAQ may boost risk appetite, weakening safe-haven currencies like USD and JPY.
- Market Volatility Indicators:
- VIX (Volatility Index): Known as the “fear gauge,” a rising VIX often signals market uncertainty and risk-off sentiment, strengthening safe-haven currencies.
Key Economic and Policy Events Impacting Indices
Stock indices are sensitive to economic releases and policy decisions, which often ripple into forex markets:
- Central Bank Decisions: Interest rate changes or policy guidance can affect both stock indices and currencies simultaneously.
- Geopolitical Events: Wars, trade disputes, and political instability often cause sudden shifts in both indices and forex pairs.
- Economic Indicators: Data such as GDP growth, unemployment rates, and inflation reports influence indices and provide context for forex traders.
By tracking these key stock indices and their associated data points, you can better understand the dynamics at play in forex markets and use them to anticipate currency trends effectively.
How to Analyze Stock Market Indices for Forex Trading
Analyzing stock indices can provide valuable insights into forex market movements. To effectively use stock indices as leading indicators, traders must understand how to interpret market sentiment, identify divergences, and select appropriate timeframes for analysis. This section outlines key methods to analyze stock indices for forex trading.
Identifying Market Sentiment Shifts
Stock indices are often the first to reflect shifts in global investor sentiment. These shifts can influence forex pairs by driving capital flows between risk-sensitive and safe-haven currencies. Here’s how to identify and interpret these changes:
- Risk-On Sentiment:
- A consistent rally in major indices like the S&P 500 or DAX 40 suggests confidence in economic growth and higher risk appetite.
- Forex Impact: Look for strength in risk-sensitive currencies (e.g., AUD, NZD, CAD) and weakness in safe-haven currencies (e.g., USD, JPY, CHF).
- Risk-Off Sentiment:
- A sharp decline or sustained sell-off in indices indicates fear or uncertainty, leading to a flight to safety.
- Forex Impact: Expect strength in safe-haven currencies and weakness in risk-sensitive ones.
- Volatility as a Signal:
- Use the VIX (Volatility Index) to confirm sentiment shifts. A rising VIX alongside falling indices signals risk aversion, while a falling VIX with rising indices confirms risk-on behavior.
Using Divergences Between Stock Market Indices and Currencies
Divergences between stock indices and currencies can signal potential trading opportunities. For example:
- Scenario 1: Stock Indices Rising but Correlated Currency Weakening
- The currency may be reacting to other factors, such as weak economic data or central bank dovishness.
- Trading Insight: Analyze whether the currency is lagging and could catch up with the index, or if fundamental drivers justify the divergence.
- Scenario 2: Stock Indices Falling but Currency Strengthening
- Safe-haven flows may be propping up the currency despite domestic economic concerns.
- Trading Insight: Confirm risk-off sentiment through cross-market analysis and consider trading safe-haven currencies.
- Example in Action:
- A sharp rally in the Nikkei 225 alongside a weakening JPY could indicate Japanese investors allocating funds abroad, signaling potential JPY weakness across forex pairs like USD/JPY or EUR/JPY.
Timeframes for Analysis
The timeframe you use to analyze stock indices will depend on your trading style and objectives.
- Intra-Day Trading:
- Focus on short-term movements in indices and their immediate impact on currencies. Use tools like pre-market futures, hourly charts, and news-driven price changes.
- Example: A sudden drop in the S&P 500 during New York trading hours could cause rapid USD strengthening against risk currencies.
- Swing Trading:
- Analyze daily or weekly trends in stock indices for broader sentiment shifts. Look for sustained rallies or declines and their impact on forex pairs over several days.
- Example: A week-long rally in the DAX 40 might suggest economic optimism in the Eurozone, potentially driving EUR/USD higher.
- Long-Term Trading:
- Use monthly trends and macroeconomic data alongside stock index performance to identify major sentiment shifts.
- Example: A multi-month downtrend in global indices might signal prolonged risk aversion, favoring safe-haven currencies like JPY and USD.
Integrating Stock Indices into Forex Trading Strategies
Incorporating stock market indices into your forex trading strategy can enhance your ability to forecast market trends and refine trade entries and exits. By leveraging insights from both fundamental and technical perspectives, traders can build a more comprehensive approach to analyzing the forex market.
Fundamental Trading Approach
Stock indices often act as a barometer for underlying economic conditions, making them invaluable in fundamental forex trading strategies. Here’s how to integrate them:
- Linking Economic Indicators to Indices and Currencies:
- Stock indices often react to economic data releases (e.g., GDP, PMI, or employment reports). Positive data may boost indices and indicate stronger currencies in the region.
- Example: A rise in the S&P 500 following robust U.S. Non-Farm Payrolls (NFP) data suggests economic optimism, potentially strengthening the USD against other currencies.
- Central Bank Policy and Stock Indices:
- Central bank decisions impact both stock indices and currencies. For instance, a dovish Federal Reserve might weaken the USD and support stock indices, while a hawkish stance could have the opposite effect.
- Strategy: Monitor indices as a real-time gauge of market reaction to central bank statements and align your forex trades accordingly.
- Cross-Market Analysis:
- Combine insights from related markets (e.g., commodities, bonds) with stock indices to confirm forex trends. For instance, rising S&P 500 and oil prices might signal AUD strength due to Australia’s commodity-driven economy.
Technical Trading Approach
Stock indices can also be analyzed technically to predict forex market movements. Traders can apply chart patterns, key levels, and momentum indicators from indices to forecast currency pair trends.
- Using Index Chart Patterns to Predict Forex Movements:
- Identify technical patterns (e.g., double tops, head-and-shoulders) on indices to anticipate forex trends.
- Example: A bearish head-and-shoulders on the DAX 40 could signal Eurozone weakness, prompting EUR/USD to decline.
- Support and Resistance Levels:
- Stock indices often respect key support and resistance levels, and breaches of these levels can signal sentiment shifts that impact forex pairs.
- Example: If the S&P 500 breaks above a major resistance level, it may signal risk-on sentiment, leading to USD weakness and AUD/USD strength.
- Momentum Indicators:
- Tools like RSI and MACD on stock indices can help gauge overbought or oversold conditions, providing clues for forex trades.
- Example: If the Nikkei 225 is overbought, it might suggest a potential JPY strengthening due to profit-taking or repatriation flows.
Risk Management Tips
When integrating stock indices into forex strategies, managing risk effectively is crucial:
- Avoid Over-Reliance on One Indicator:
- While stock indices provide valuable insights, they should not be the sole basis for trades. Combine index analysis with other tools such as economic data, sentiment indicators, and technical patterns in forex charts.
- Adjust Position Sizing:
- When trading based on stock indices, volatility can be higher due to the interconnected nature of markets. Adjust position sizes to account for increased risk.
- Diversify Analysis:
- Analyze multiple indices for confirmation. For example, align movements in the S&P 500, DAX 40, and Nikkei 225 to assess global sentiment rather than relying on a single market.
Examples of Strategies
- Correlation-Based Strategy:
- Track the S&P 500 for risk-on/risk-off sentiment and adjust USD/JPY or AUD/USD trades accordingly.
- Divergence Strategy:
- Identify divergences between the DAX 40 and EUR/USD. If the DAX rallies but EUR/USD declines, investigate whether forex markets are lagging or driven by a different factor.
- Breakout Strategy:
- Trade forex pairs aligned with significant breakouts in indices. For instance, a bullish breakout in the Nikkei 225 could indicate JPY weakness, favoring long positions in USD/JPY or EUR/JPY.
Tools and Resources for Monitoring Stock Market Indices
To effectively incorporate stock indices into your forex trading strategy, you need reliable tools and resources for real-time monitoring, analysis, and interpretation. This section highlights the most valuable platforms and techniques for staying informed about stock indices and their implications for forex markets.
Online Trading Platforms and Brokers
Most forex trading platforms provide access to stock indices for monitoring and analysis.
- MetaTrader (MT4/MT5):
- Many brokers offer major indices like the S&P 500, Nikkei 225, and DAX 40 on MT4/MT5 platforms.
- Features: Live price feeds, charting tools, and custom indicators for technical analysis.
- cTrader:
- A popular platform with advanced charting tools and multiple stock index options for traders seeking alternative software.
- Broker Platforms:
- Brokers like ThinkMarkets, Interactive Brokers, and IG Markets offer a wide range of stock indices with detailed analysis tools and integrated economic calendars.
News and Market Data Platforms
Real-time news and data are essential for understanding how stock indices impact forex markets.
- Bloomberg Terminal:
- A premium resource for professionals, providing real-time data on global indices, economic events, and forex markets.
- Use Case: Monitor live sentiment shifts in indices and their immediate forex impact.
- Reuters (Eikon):
- Offers extensive coverage of stock indices and macroeconomic news, ideal for analyzing cross-market relationships.
- Free News Platforms:
- Yahoo Finance and CNBC: Great for general updates on stock indices, market sentiment, and major events.
- ForexFactory: Integrates forex-relevant stock index news with economic calendars.
Charting Tools for Technical Analysis
- TradingView:
- Widely used for multi-asset analysis, including indices and forex pairs.
- Features: Advanced charting tools, customizable indicators, and social sharing for insights.
- Use Case: Plot correlations between stock indices (e.g., S&P 500) and forex pairs like USD/JPY or AUD/USD.
- Thinkorswim (by TD Ameritrade):
- A powerful platform with extensive technical analysis capabilities for indices and other assets.
- ProRealTime:
- Professional-grade charting software offering detailed index analytics with customizable layouts.
Economic Calendars and Market Sentiment Tools
- Economic Calendars:
- ForexFactory and Investing.com: Highlight key events influencing stock indices and currencies, such as GDP releases or central bank decisions.
- Market Sentiment Indicators:
- VIX (Volatility Index): Measures market fear and risk sentiment, often moving inversely to indices like the S&P 500.
- COT Reports (Commitments of Traders): Provides data on speculative positions in major indices and currencies.
Mobile Apps for On-the-Go Monitoring
- Bloomberg & CNBC Apps:
- Offer real-time news and updates on stock indices and forex markets.
- TradingView Mobile App:
- Provides the same functionality as the desktop version, with live charts and multi-market tracking.
- MetaTrader Mobile:
- Enables monitoring of both indices and forex pairs, ensuring you stay connected to the markets anytime, anywhere.
Algorithmic and Quantitative Tools
- Python & APIs (e.g., Alpha Vantage, Yahoo Finance):
- Use APIs to programmatically fetch stock index and forex data for backtesting or real-time strategy implementation.
- Example: Build a model that analyzes correlations between the S&P 500 and USD/JPY.
- QuantConnect & Trading Bots:
- Develop automated systems to analyze and trade based on stock index movements and forex trends.
By leveraging these tools and resources, you can stay ahead of market trends, make informed decisions, and seamlessly integrate stock index analysis into your forex trading strategy.
Examples of Stock Indices Guiding Forex Trades
Understanding how stock indices influence forex pairs becomes clearer when examined through real-world scenarios. This section explores examples of how movements in key stock indices have historically impacted forex markets, helping traders use these correlations effectively.
S&P 500 and USD/JPY During Risk Sentiment Shifts
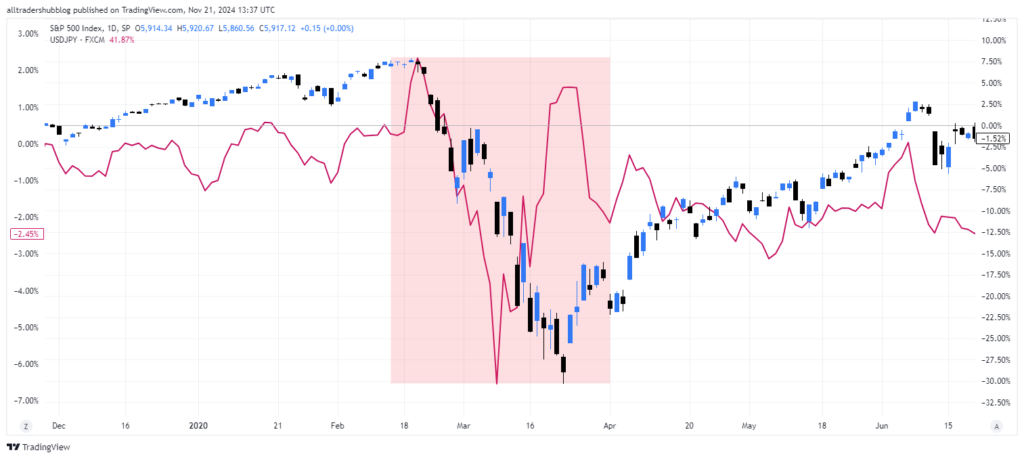
- Example: COVID-19 Pandemic (March 2020)
- Scenario: The S&P 500 experienced a massive sell-off as investors panicked over the global pandemic’s economic implications.
- Forex Impact: The USD initially strengthened as a safe-haven currency. However, as the U.S. Federal Reserve slashed interest rates and injected liquidity, the USD weakened against the JPY, another safe-haven currency, which gained strength due to risk-off sentiment.
- Lesson: Monitoring the S&P 500’s crash helped traders anticipate risk-off flows, favoring short USD/JPY trades.
Nikkei 225 and JPY Crosses
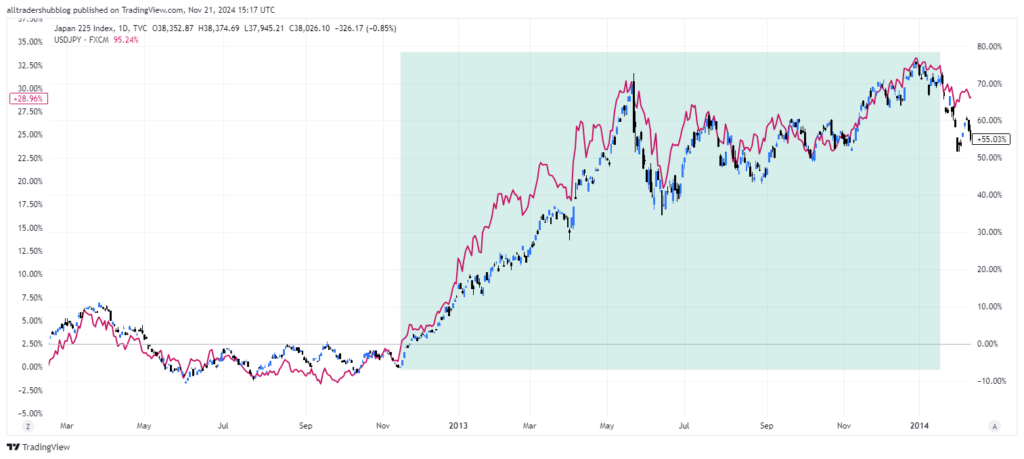
- Example: Post-Abenomics (2013)
- Scenario: The introduction of Abenomics policies in Japan led to massive monetary easing, sparking a rally in the Nikkei 225.
- Forex Impact: As the Nikkei rallied, the JPY weakened due to capital outflows and investor optimism about Japan’s export-driven economy. Pairs like USD/JPY and EUR/JPY surged during this period.
- Lesson: The positive correlation between the Nikkei 225 and JPY weakness provided clear trading opportunities, particularly for long positions in USD/JPY.
DAX 40 and EUR/USD
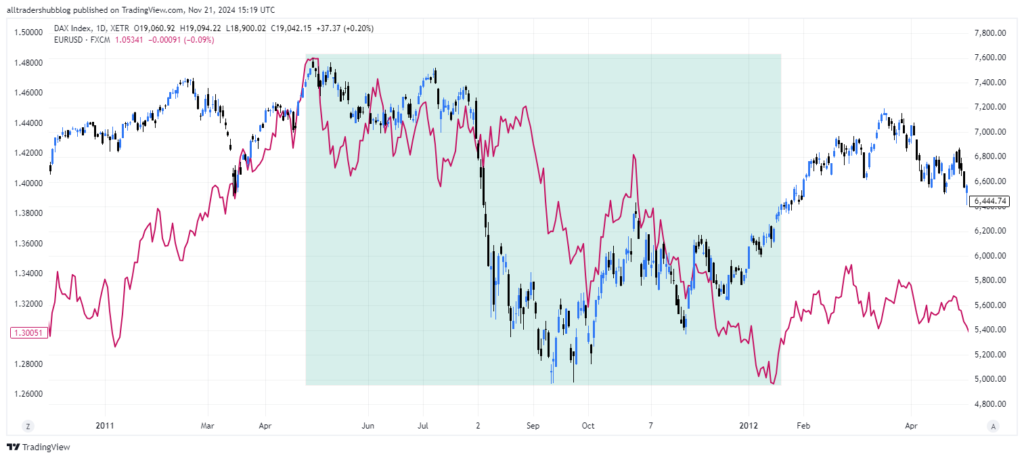
- Example: European Debt Crisis (2011-2012)
- Scenario: During the European debt crisis, the DAX 40 suffered heavy losses as concerns about the Eurozone’s economic stability grew.
- Forex Impact: The EUR/USD pair declined sharply during the DAX’s downturn, reflecting fears of contagion across the Eurozone.
- Lesson: Watching the DAX’s weakness allowed traders to anticipate EUR/USD sell-offs as the index mirrored broader Eurozone instability.
FTSE 100 and GBP/USD During Brexit
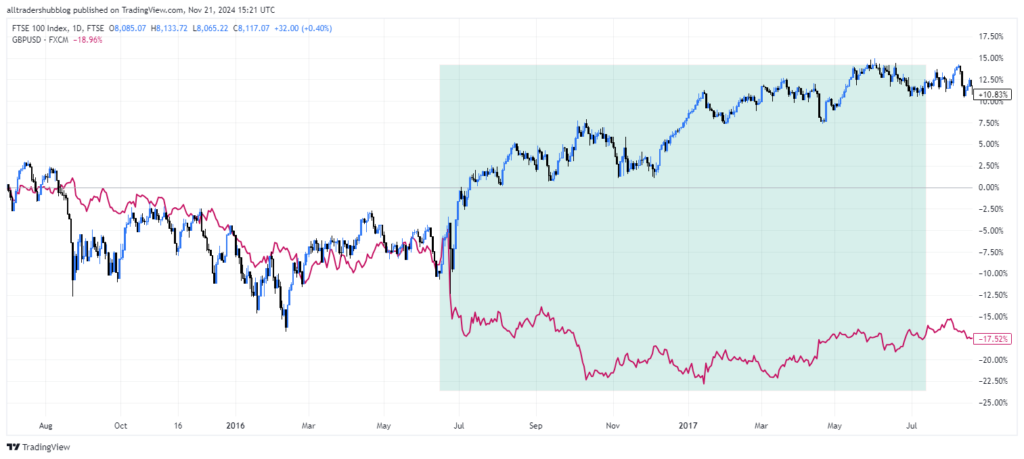
- Example: Brexit Referendum (June 2016)
- Scenario: Leading up to and following the Brexit vote, the FTSE 100 became highly volatile, reflecting uncertainty about the UK’s economic future.
- Forex Impact: After the vote to leave the EU, the GBP/USD plummeted as confidence in the British economy waned. Interestingly, the FTSE 100 initially rallied post-referendum due to the depreciation of the GBP, benefiting export-heavy companies.
- Lesson: Divergences between the FTSE 100 and GBP/USD revealed opportunities to short GBP/USD while staying cautious about index trends.
Hang Seng Index and AUD/USD
- Example: U.S.-China Trade War (2018-2019)
- Scenario: The Hang Seng Index faced significant pressure during the U.S.-China trade war, as fears of reduced global trade and economic growth escalated.
- Forex Impact: The AUD, heavily reliant on Chinese trade, weakened significantly against the USD, mirroring the Hang Seng’s declines.
- Lesson: Tracking the Hang Seng’s performance during trade tensions offered early warnings for short AUD/USD positions.
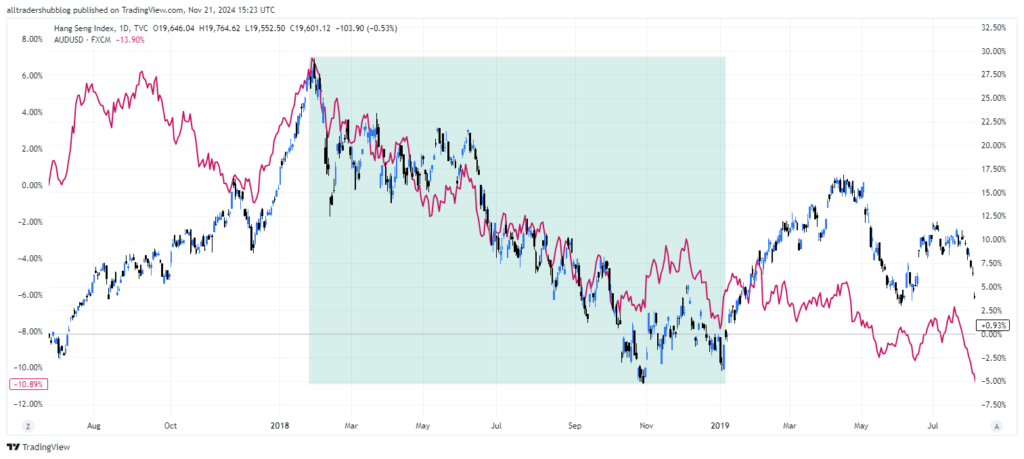
Correlation Between Global Stock Market Indices and Commodity Currencies
- Example: Oil Price Crash (2020)
- Scenario: The collapse in oil prices during the COVID-19 pandemic caused the Canadian Dollar (CAD) to weaken sharply. Simultaneously, the S&P 500 and other global indices plummeted due to risk aversion.
- Forex Impact: The CAD’s sensitivity to oil prices, combined with the global sell-off in equities, led to USD/CAD strength as the USD benefited from its safe-haven appeal.
- Lesson: Combining insights from commodity-driven stock indices and commodity prices offered a clearer picture of USD/CAD trends.
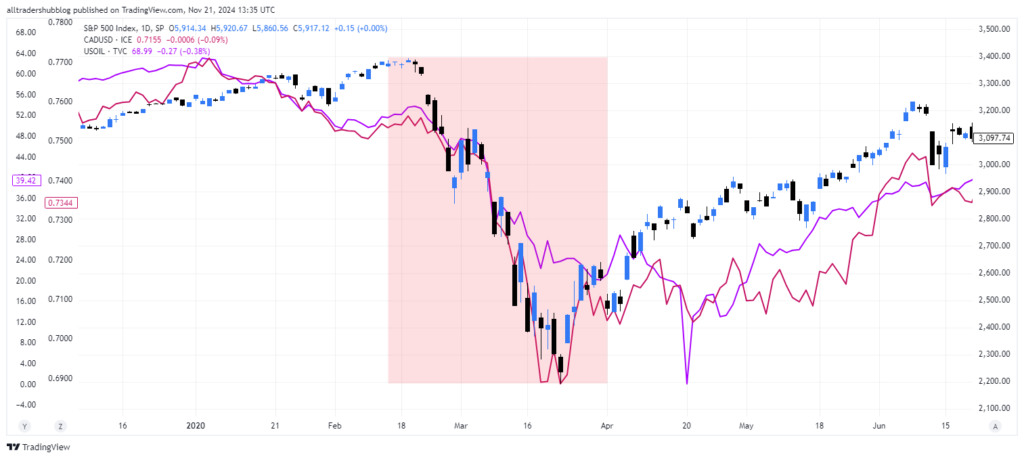
Key Takeaways from Examples
- Stock Indices as Sentiment Barometers:
Major indices often act as leading indicators for global risk sentiment, which directly impacts forex pairs. - Regional Relationships:
Correlations between regional indices and currencies (e.g., DAX 40 and EUR, Nikkei 225 and JPY) can provide actionable insights for trades. - Geopolitical and Economic Events:
Stock indices react quickly to geopolitical and economic events, making them essential tools for forecasting forex market reactions. - Divergences Provide Opportunities:
Pay attention to instances where stock indices and forex pairs move in opposite directions, as these divergences can signal profitable trades.
By studying these examples, traders can better understand how to use stock indices as part of a broader forex trading strategy, improving both prediction accuracy and trade execution.
Conclusion
Integrating stock indices into forex trading strategies offers traders a powerful way to anticipate market movements and enhance decision-making. By understanding the relationship between stock indices and currencies, recognizing key sentiment shifts, and using technical and fundamental analysis, traders can gain a broader perspective on global market dynamics.
By combining the insights derived from stock indices with a disciplined approach to risk management, traders can build a more robust, informed, and effective forex trading strategy. As the interconnectedness of global markets grows, mastering the use of stock indices as leading indicators will provide traders with a valuable edge in navigating the complexities of the forex market.
