In this course, we used the UK currency against the US currency and we went through four economic indicators to gauge whether we are long or short the GBP/USD. This fundamental analysis is a well-defined system or approach to help traders translate various economic data into trade ideas.
This process can be replicated for any currency pair you wish to analyze. All you have to do is get the data for the currency you want to trade and use Excel software to arrange, analyze, and gauge the fundamental bias for the currency pair.
So let’s go back to our analysis:
Relative GDP Growth Analysis
The analysis suggests that the difference in the GDP growth rates of the two economies (UK and US) is negative (-0.9%), indicating that the UK economy is growing more slowly than the US economy.
A negative relative GDP growth indicates that one economy is underperforming compared to the other in terms of economic expansion. This could influence investor sentiment and impact currency values, especially in the foreign exchange market. Investors may adjust their portfolios based on expectations of diverging economic performances.
Relative GDP Growth: -0.90%
Score: -2
The Fundamental Bias: Short Bias (Sell GBP/Buy USD)
Now, let’s move to the second indicator in our analysis.
Interest Rate & Carry Trade Analysis
A -0.14% carry suggests that there might be a negative carry associated with holding a long position in GBP/USD.
Negative carry can influence the attractiveness of a currency pair for carry traders. Traders might be less inclined to hold a currency with a negative carry, which could impact the demand for that currency in the Forex market.
Traders considering the carry trade strategy may take into account the carry associated with holding a particular currency pair when making decisions. A negative carry may influence the choice of currency pairs for carry trading.
It’s important to note that the interest rate differentials and carry dynamics can change over time based on central bank policies, economic conditions, and market expectations.
Carry Trade Analysis: -0.14%
Score: -1
Fundamental Bias: Short Bias (Sell GBP/Buy USD)
The next indicator in our list is the Balance of Payments and Trade Balance Analysis.
Balance of Payments & Trade Analysis
The fundamental factors are favoring a stronger British Pound (GBP) compared to the US Dollar (USD).
A long bias in the context of the GBP/USD suggests an expectation that the GBP is likely to strengthen against the USD. If the UK has a negative balance in its foreign currency reserves (a surplus), it might indicate that the UK is holding more foreign currency assets than liabilities. This surplus could be seen as a positive factor for the GBP.
BOP UK-US: -33866 (surplus)
Trade Analysis: +518.99%
Score: +10
Fundamental Bias: Long Bias (Buy GBP/Sell USD)
Stock Market Analysis
The FTSE 100 index fell from a high at 7461.93 to current value of 6712.70. The percentage change of FTSE 100 in USD equals -31.77%. This means that the stock market is falling due to lower earnings.
Stock Market Return: -31.77%
Score: -2
Fundamental Bias: Short Bias (Sell GBP/Buy USD)
The Final score is: +5
The final score for our weekly analysis is +5 which means that the overall fundamental bias for the GBP/USD is Long.
Now, let’s take a look at the technical side to see if our fundamental bias aligns with the technicals for the same week.
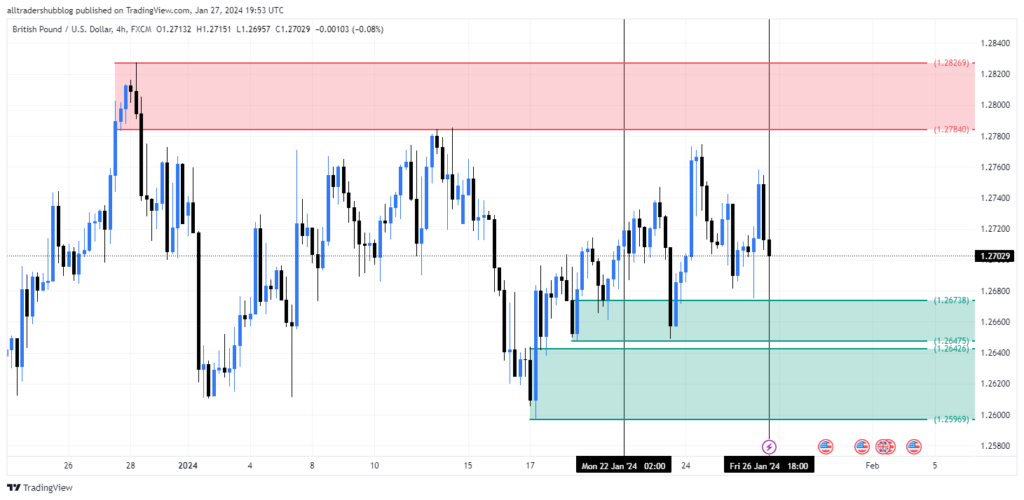
Examples from the Market
Now that we are familiar with our fundamental approach, we are going to take a look at a few currency pairs from the same week (22nd – 26th January 2024) and their respective charts:
AUD/USD
Relative GDP Growth:
- Value: -0.30%
- Score: -2
- Bias: Short
Interest Rate & Carry Trade:
- Value: -1.01%
- Score: -3
- Bias: Short
BOP and Trade Analysis:
- Value: 1.5%
- Score: +1
- Bias: Long
Stock Market Return:
- Value: -20.83%
- Score: -2
- Bias:Short
Fundamental Bias:
- Final Score: -6
- Bias: Short
Technical Analysis:
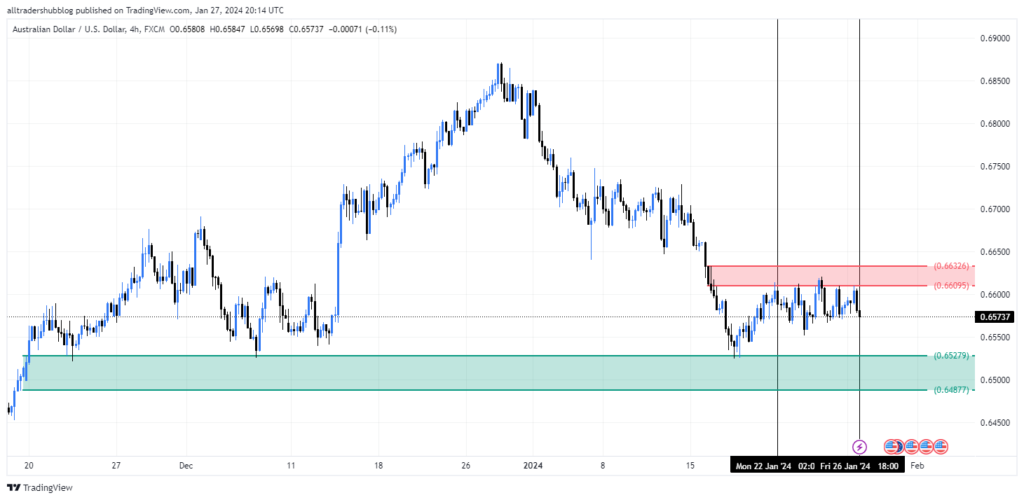
AUD/USD tested a supply zone around 0.66095/0.66326 and started moving sideways. On Friday at the close, price showed signs of more momentum to the downisde. The overall fundamental bias was aligned with the technicals to enter a short position on AUD/USD despite the low volatility in this currency pair.
USD/JPY
Relative GDP Growth:
- Value: 0.50%
- Score: 1
- Bias: Long
Interest Rate & Carry Trade:
- Value: 5.35%
- Score: 1
- Bias: Long
BOP and Trade Analysis:
- Value: -17.12%
- Score: -2
- Bias: Short
Stock Market Return:
- Value: -15.42%
- Score: -7
- Bias: Short
Fundamental Bias:
- Final Score: -7
- Bias: Short
Technical Analysis:
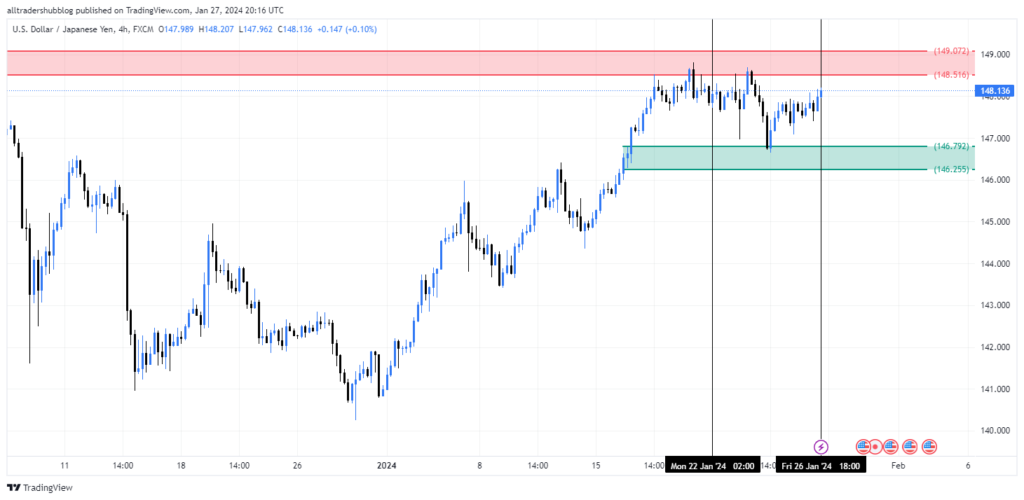
USD/JPY moved sideways between supply and demand zones giving us a short position right at the test of the supply zone around 148.516/149.072. Again, fundamentals are aligned with the technicals.
EUR/JPY
Relative GDP Growth:
- Value: 0.30%
- Score: 2
- Bias: Long
Interest Rate & Carry Trade:
- Value: 3.93%
- Score: 10
- Bias: Long
BOP and Trade Analysis:
- Value: -20.75%
- Score: -3
- Bias: Short
Stock Market Return:
- Value: 0.44%
- Score: 2
- Bias: Long
Fundamental Bias:
- Final Score: 11
- Bias: Long
Technical Analysis:
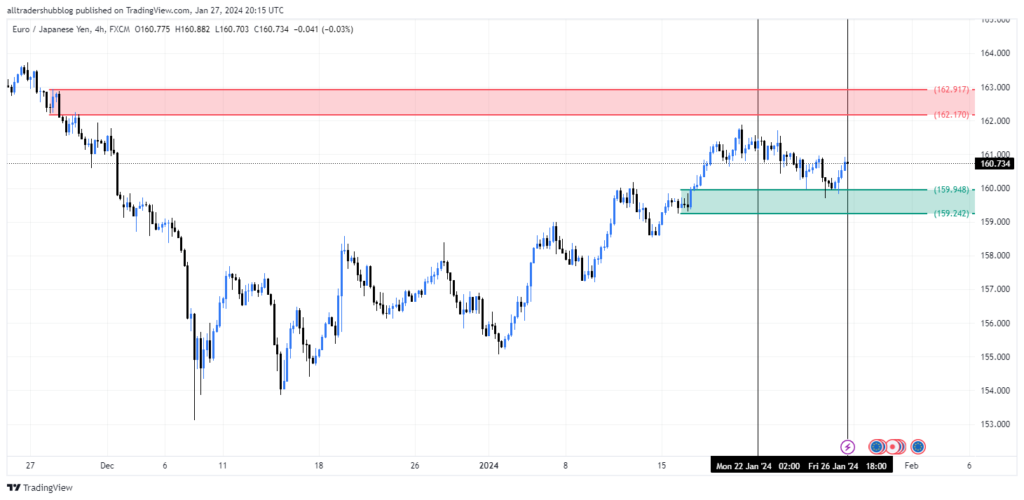
EUR/JPY went down to the demand zone around 159.242/159.948 and gives us a buy opportunity at 159.948 level and still running as long as our fundamental bias is long.
EUR/USD
Relative GDP Growth:
- Value: -0.20%
- Score: -2
- Bias: Short
Interest Rate & Carry Trade:
- Value: -1.43%
- Score: -3
- Bias: Short
BOP and Trade Analysis:
- Value: -15.41%
- Score: -2
- Bias: Short
Stock Market Return:
- Value: -3.93%
- Score: -3
- Bias: Short
Fundamental Bias:
- Final Score: -10
- Bias: Short
Technical Analysis:
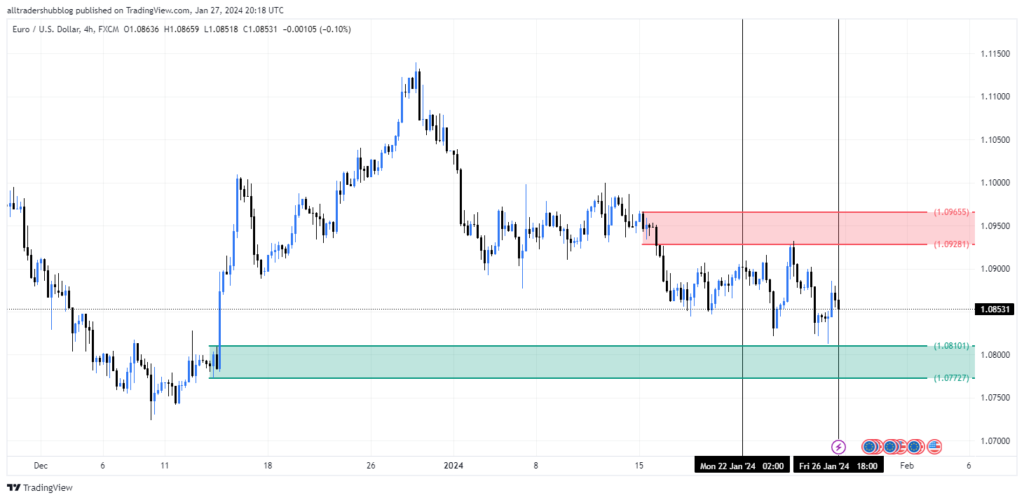
EUR/USD tested the supply zone around 1.09281/1.09655 and went down giving us a nice sell opportunity which was aligned with our fundamental bias.
CAD/JPY
Relative GDP Growth:
- Value: 0.60%
- Score: 2
- Bias: Long
Interest Rate & Carry Trade:
- Value: 5.02%
- Score: 4
- Bias: Long
BOP and Trade Analysis:
- Value: -22.35%
- Score: -3
- Bias: Short
Stock Market Return:
- Value: 2.71%
- Score: 3
- Bias: Long
Fundamental Bias:
- Final Score: 6
- Bias: Long
Technical Analysis:
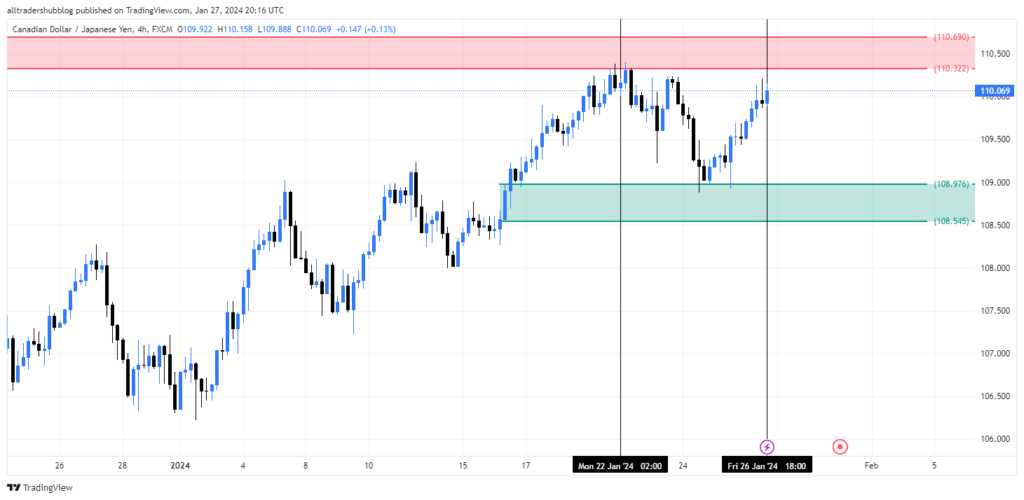
CAD/JPY tested the demand zone around 108.545/108.976 and went up giving us a nice buying opportunity. Again, aligned with our fundamental bias.
Now, if the fundamental bias is short, but the technicals disagree with our fundamentals, we don’t trade. We wait for price to align with the fundamental bias and we enter. We can time our entry using COT report (Committment of Traders). As long as our fundamentals and technicals are aligned, we trade. Otherwise, we be patient.