Support and resistance are the backbone of technical analysis in Forex trading. They represent areas on a chart where price tends to react, pause, or reverse. Understanding these zones can elevate your market analysis, enhance entry/exit timing, and improve your overall strategy. But how do you accurately identify these levels?
This lesson breaks it down step by step using proven methods, tools, and practical examples—so you can start spotting key turning points like a pro.
What Are Support and Resistance?
Let’s begin with the basics:
- Support is a price level where a currency pair tends to stop falling and may reverse direction. It reflects a concentration of buying interest—think of it as a floor beneath the market.
- Resistance is the opposite. It’s a price level where the market often struggles to break higher. Sellers dominate here, making it a ceiling above the current price.
These levels are rarely precise points. They are zones, and price may approach them multiple times before reacting.

Why Support and Resistance Matter in Forex
- Market Psychology: These zones reflect collective trader behavior—buyers stepping in at support and sellers unloading at resistance.
- Trade Setup Foundation: Most technical strategies—breakouts, reversals, trend following—are built around these levels.
- Risk Management: Knowing where price is likely to reverse helps set smarter stop-loss and take-profit orders.
How to Identify Support and Resistance: 5 Proven Methods
1. Historical Price Data
History often repeats itself in Forex, especially when it comes to support and resistance.
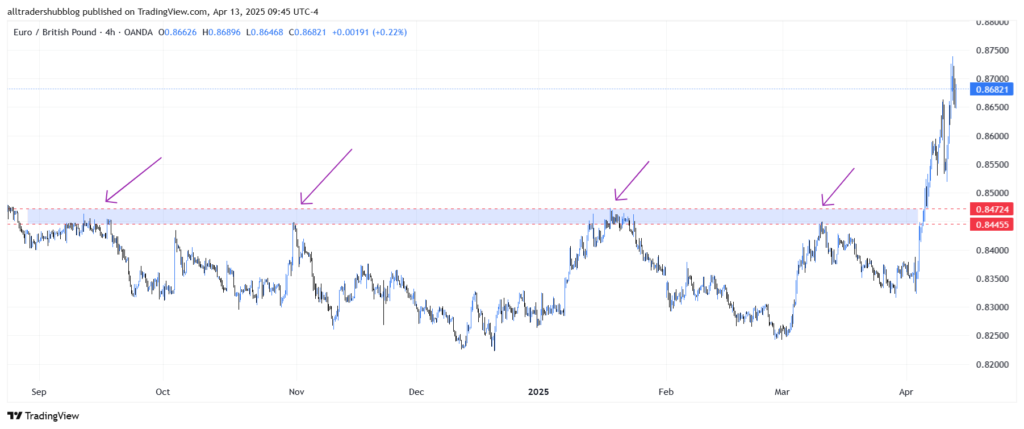
- Look Left: Scan the chart for previous highs and lows. If price stalled or reversed at a certain level before, it might do so again.
- Multiple Touches: The more often price bounces off a level without breaking it, the stronger the support or resistance.
📌 Example: If EUR/GBP reversed at 0.84455 four times in the past before it broke above it.
2. Previous Support and Resistance Levels (Zone Theory)
Rather than fixed price points, think of these levels as zones—ranges where buying or selling pressure builds.
- Use previous reaction areas—not just candles’ wicks but clusters of price activity—to draw your zones.
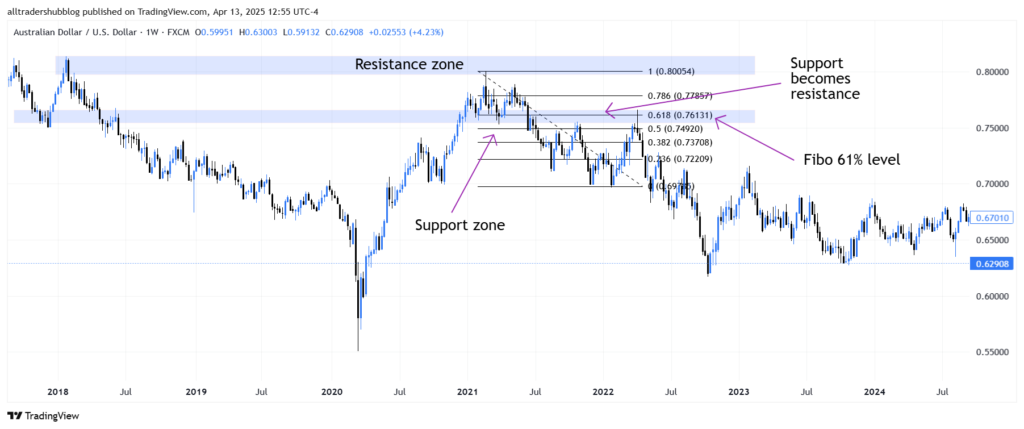
- Support can turn into resistance and vice versa. This is called a role reversal.
📌 Pro Tip: Draw rectangles instead of lines to visualize zones.

3. Technical Indicators
Indicators can act as dynamic support and resistance or help you spot them faster.
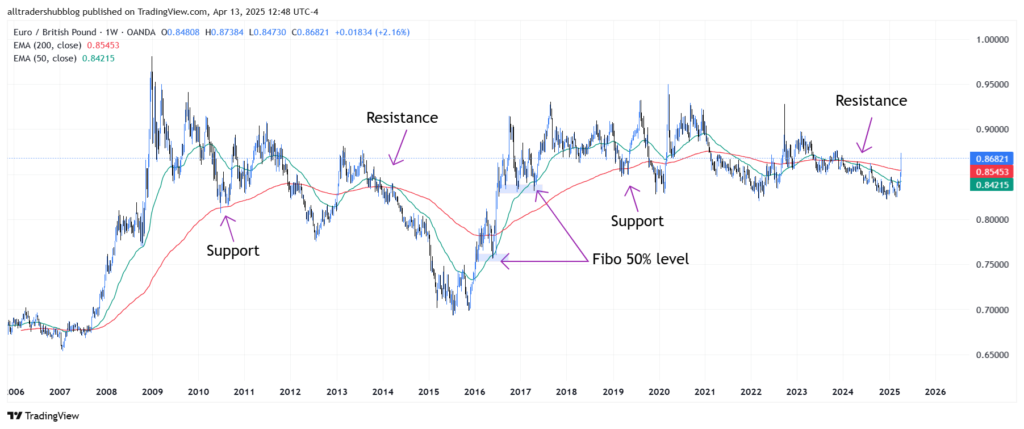
- Moving Averages: A 50 or 200 EMA often serves as dynamic support/resistance in trending markets.
- Trendlines: Connect two or more swing highs (for resistance) or swing lows (for support) to draw a trendline.
- Fibonacci Retracement: Draw from a major high to low in a trend—levels like 38.2%, 50%, and 61.8% often line up with S&R.
- Bollinger Bands: These can signal overbought or oversold conditions, coinciding with potential resistance or support.
📌 Example: In a downtrend, the 61.8% retracement might align with previous resistance and a trendline—triple confirmation.
4. Peaks and Troughs (Swing Analysis)
Support and resistance are often found at market turning points:
- In an uptrend: Higher highs are resistance, and higher lows are support.
- In a downtrend: Lower highs act as resistance, and lower lows become support.
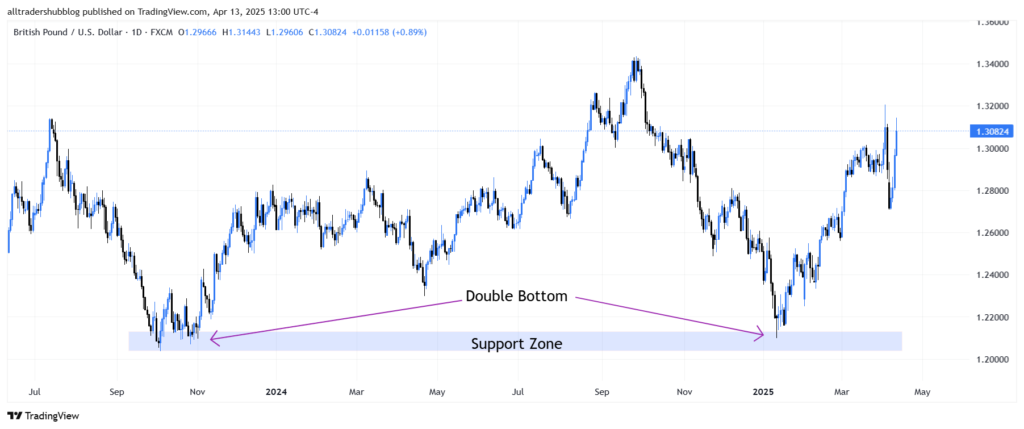
📌 Example: If GBP/USD forms a double bottom around 1.2000 levels, that trough becomes a key support zone.
5. Volume and Time Frame Considerations
- Volume Confirmation: High volume at a certain level adds weight. It shows institutional interest.
- Time Frame Strength: Support and resistance on higher timeframes (daily, weekly) are more significant than on lower ones (5m, 15m).
📌 Pro Tip: Always mark S&R on higher timeframes first, then refine on lower ones for entries.
How to Draw Support and Resistance Lines (Step-by-Step)
- Zoom Out: Start with a daily or weekly chart to identify major turning points.
- Mark Peaks and Troughs: Use horizontal lines or zones at swing highs/lows.
- Refine Using Trendlines: Connect a series of higher lows or lower highs.
- Add Indicators: Overlay moving averages or Fibonacci retracements for extra confluence.
- Switch to Lower Timeframe: Find minor S&R zones for tactical trade entries.
📌 Bonus Tip: Use trading platforms like TradingView or MetaTrader to draw and label your zones cleanly.
Key Reminders
✅ Support and resistance levels are not fixed; they are flexible zones.
✅ Levels gain strength with more touches, confluence, and higher volume.
✅ Always check for role reversal—broken support often becomes resistance and vice versa.
✅ Don’t rely on one method alone. Combine tools and techniques for the best results.
Conclusion
Mastering support and resistance is like learning to read the market’s mind. Once you grasp how price reacts at these key zones, you’ll stop chasing candles and start anticipating moves like a strategist.
Whether you’re trading breakouts, reversals, or trends, understanding support and resistance gives you a solid edge. It turns noise into structure—and confusion into confidence.