Given the US macroeconomic indicators and the latest data, we can analyze the overall macroeconomic sentiment on the U.S. dollar (USD). Each indicator tells a different part of the economic story, which together can paint a broader picture of the economic health of the United States and its implications for the USD.
1. Manufacturing Sector (ISM PMI)
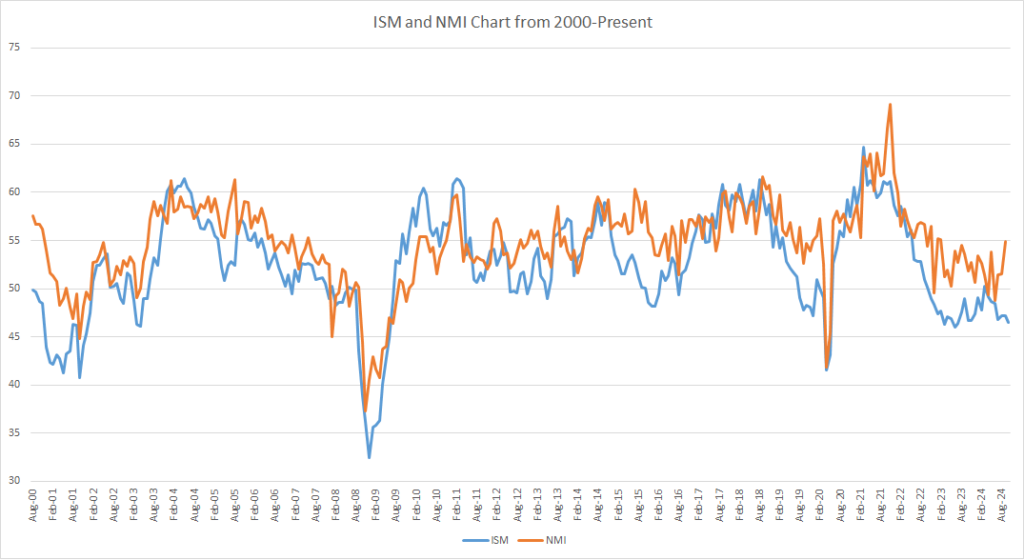
The Institute for Supply Management (ISM) Purchasing Managers’ Index (PMI) for October fell to 46.5, marking a decline from September’s 47.2. A reading below 50 signals contraction in the manufacturing sector, suggesting persistent challenges in the US manufacturing economy. Factors likely contributing to this contraction include elevated input costs, weaker demand, and potential lag effects from tighter financial conditions.
2. Non-Manufacturing Sector (NMI)
The Non-Manufacturing Index (NMI), which covers the services sector, increased from 51.5 in August to 54.9 in September, showing resilience. Service industries, which comprise a significant portion of the US economy, continue to show expansion, likely driven by steady consumer spending. This divergence between the manufacturing and non-manufacturing sectors may suggest that consumer-driven segments are cushioning the economy despite manufacturing struggles.

3. Consumer Sentiment (UMCSI)
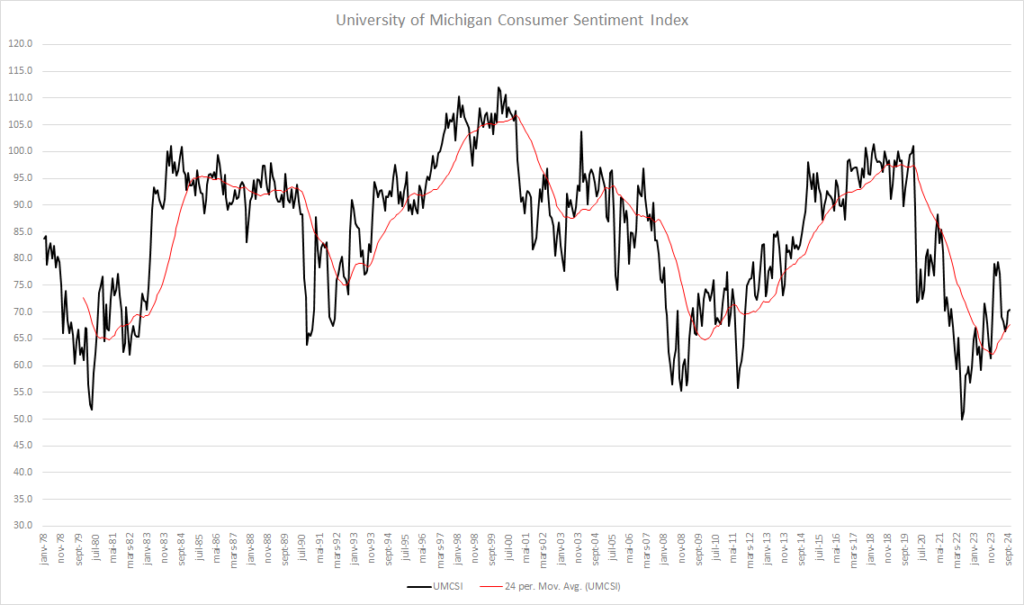
The University of Michigan Consumer Sentiment Index (UMCSI) showed a slight uptick in October, reaching 70.5 from September’s 70.1. Although still below pre-pandemic levels, the gradual rise in sentiment suggests that consumers remain cautiously optimistic about economic conditions. This optimism may contribute to sustained spending in the near term, helping to support growth in the services sector.

4. Housing Sector (Building Permits)
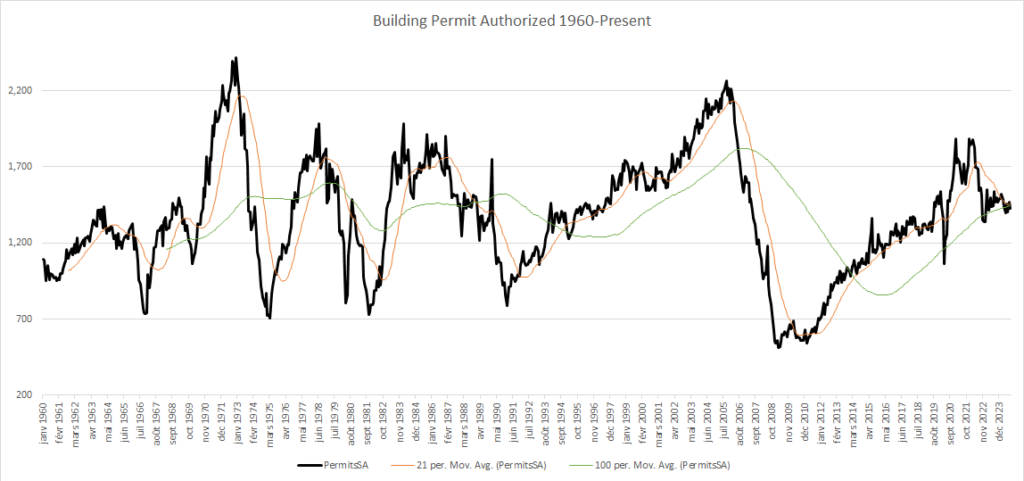
Building permits declined from 1,470 in August to 1,425 in September, pointing to a slight slowdown in the housing market. High mortgage rates and tighter lending standards may be limiting new construction activity. A continued downturn in building permits could dampen economic growth, as the housing sector is a significant contributor to investment spending.

5. Money Supply (M2)
The M2 money supply shows growth, with the latest three-month average rising to 16.12%. This increase could indicate an easing in financial conditions or higher liquidity in the economy, potentially influencing inflationary pressures. However, if this trend continues, the Federal Reserve may weigh its impact on price stability, especially if inflation remains elevated.
6. Interest Rates
The average interest rate remains in negative territory, reflecting accommodative policy conditions. Although the Federal Reserve has begun raising rates, persistently low real rates could continue encouraging borrowing and investment but may also exacerbate inflationary pressures if economic demand remains strong.
7. Inflation
Inflation remains moderate, with a year-over-year rate of 2.4% and a monthly increase of 0.2% in September. This stabilization could signal that prior rate hikes are beginning to curb inflation without overly restricting economic activity. However, with ongoing global economic uncertainty, the inflation outlook may shift if supply chain issues or commodity prices become volatile.
8. Labor Market (Non-Farm Payrolls)
Non-farm payrolls increased marginally from September to October, indicating a stable labor market. Though the pace of job creation is slow, the low unemployment rate suggests that the labor market is near full employment. However, if employment growth slows further, it could signal a weakening economic outlook.
9. Central Bank Balance Sheet to GDP
The Federal Reserve’s balance sheet relative to GDP decreased from Q2 to Q3, implying that the central bank is gradually unwinding pandemic-era stimulus measures. This contraction might be part of an effort to address inflation while preparing for potential future interventions if economic conditions deteriorate.
10. Treasury 10-Year Yield
The yield on the 10-year Treasury rose from 3.834% in October to 4.28% in November, reflecting investor expectations of higher future inflation or risk premiums. Rising yields increase borrowing costs for businesses and consumers, which may gradually slow economic activity and investment.
11. Government Debt to GDP
US government debt remains elevated, with a debt-to-GDP ratio of 120.03% in Q2. High debt levels could limit fiscal policy options if economic conditions worsen, constraining future government stimulus efforts and posing long-term fiscal sustainability risks.
12. Fiscal Deficit (Surplus/Deficit Percentage)
The fiscal deficit as a percentage of GDP stands at -7.84%, indicating continued reliance on deficit spending. This trend, combined with high debt levels, underscores the fiscal challenges facing the US government, potentially necessitating policy adjustments to maintain economic stability.
Outlook Summary
The US economy faces a mixed outlook with contrasting signals across different sectors:
- Challenges in Manufacturing: Ongoing contraction suggests continued pressure on production and exports.
- Resilience in Services: Growth in the non-manufacturing sector and steady consumer sentiment provide a buffer against manufacturing weakness.
- Labor Market Stability: Low but stable employment growth supports household income and spending.
- Fiscal and Monetary Tightening Risks: Rising government debt, deficits, and tightening monetary conditions may constrain fiscal flexibility and influence interest rates.
Conclusion: The US economic forecast remains cautiously optimistic but contingent on inflation stability, labor market resilience, and effective fiscal management. Tighter monetary policy and global uncertainties may weigh on growth, with service-driven economic momentum and controlled inflation serving as key stabilizers.
